
Krishna Pera session
Introduction
On Friday, Dec 22, we had a very interesting session by Mr Krishna Pera, an experienced IT and Data Analytics professional. Mr Pera addressed some important questions:
- How does one define a data-driven organization?
- When exactly do we say an organization is 100% data-driven?
- How does an organization create a roadmap for becoming data-driven?
- How does an organization choose and prioritize analytics investments? (Gartner estimates 85% of analytics projects either completely fail, or do not deliver the intended value)
- How does an organization create a strategic roadmap for becoming data-driven?
- How does an organization improve data governance and data quality?
About Mr. Krishna Pera
With over three decades of experience in IT and business transformation consulting, Mr. Krishna Pera has worked across industry verticals. He has been Head of Global Business Services for a Singapore-listed $34 bn Food & Agri-business company. Prior to that he was the Chief Operating Officer of a knowledge-process outsourcing company specializing in digital content solutions for global information media companies.
During his career Mr. Pera has established and scaled several businesses from scratch, and successfully turned around one midsized services company. Mr. Pera has pioneering experience in setting-up and scaling Shared Services Centers, Captives, and ODCs for Fortune-500 companies, including the first ever in a validated environment.
Mr. Pera has a deep understanding of strategic information lifecycle management in transnational firms. Mr. Pera has conducted several workshops full of actionable insights and helped companies derive tremendous value by cutting their direct costs and SG&A. Mr Pera set up an Analytics COE in one of his assignments. He developed a ground up approach for building a data driven organization.
Currently Mr Pera runs a consulting entity focused on enabling companies on their journey to become data-driven organizations, and is a visiting faculty at IIM Udaipur, and IIM Bangalore. Mr. Pera considers working towards a 'scalable process-driven-success' as against ‘people-dependent-success’ as the biggest challenge in most organizations. Mr. Pera also mentors startups working on innovative products and solutions.
Mr Pera has a PGDM from IIM, Bangalore, and graduate degrees in Law and Engineering.
On his book
Mr Pera’s book, ‘Big Data for Big Decisions - Building a Data Driven Organization’ (P. by Taylor & Francis, USA, 2022) stems directly from the corporate workshops he conducts as a part of his consulting assignments. The workshops are focused on ‘creating a roadmap & a business-case for building a data-driven organization’, and the typical duration varies from half a day to five full days. He also delivered occasional lectures on the subject for ASCI and NASSCOM.
Mr Pera published a few articles in Data Science Central between 2016 and 2019. These articles were popular with thousands of downloads and were cited by global consulting firms and Data Scientists.
One of the editors from Taylor & Francis approached Mr Pera to write a book a month before the Covid lockdown. The book was released in USA and Europe in early 2023. A special India Edition was published in December 2023. Mr Pera now offers a two-credit course at IIM Udaipur, and IIM Bangalore.
Data driven organization
Becoming a data-driven organization is no longer a choice. It is a necessity to compete effectively in the next decade.
Every enterprise aspires to become 100% data-driven and every CDAO (Chief Data Analytics Officer) has a budget. However, Gartner estimates over 80% of all analytics projects fail to deliver the intended value. Most CDAOs think a data-driven organization is a distant dream, especially while they are still struggling to articulate the value from analytics. A few isolated successes or a one-time leveraging of big-data for decision-making do not make an organization data-driven.
Investments in analytics
How exactly can an investment in analytics work wonders in enhancing the business performance of a company? While, A few companies get it right, most companies seem to get very little out of their analytics and big-data investments.
Online companies like Google and Amazon are among the exceptions. They have the advantage of having all the data they would ever need available right on their platform.
Key themes
The following are the typical themes of the workshops conducted by Mr Pera for various clients:
- How to create a roadmap & a business case for setting up a data-driven organization.
- How to build a data-driven organization and derive real $ value from investments in data, analytics, and AI.
- Data Lifecycle and the Importance of Data Quality.
- Enterprise IT strategy & Data strategy
- Integrated Data-governance framework
- Data-driven Marketing – The Concept of Micromarketing & Geospatial Analytics
- Data-driven decision-making in action: Illustrated through Data-driven marketing.
- Geospatial analytics focused on micro-markets – e.g. the 600,000+ towns and villages of India.
- Analytics focused on Key Organizational Decisions: The 10% of the decisions that account for 90% of the business outcomes.
Focus on the decisions
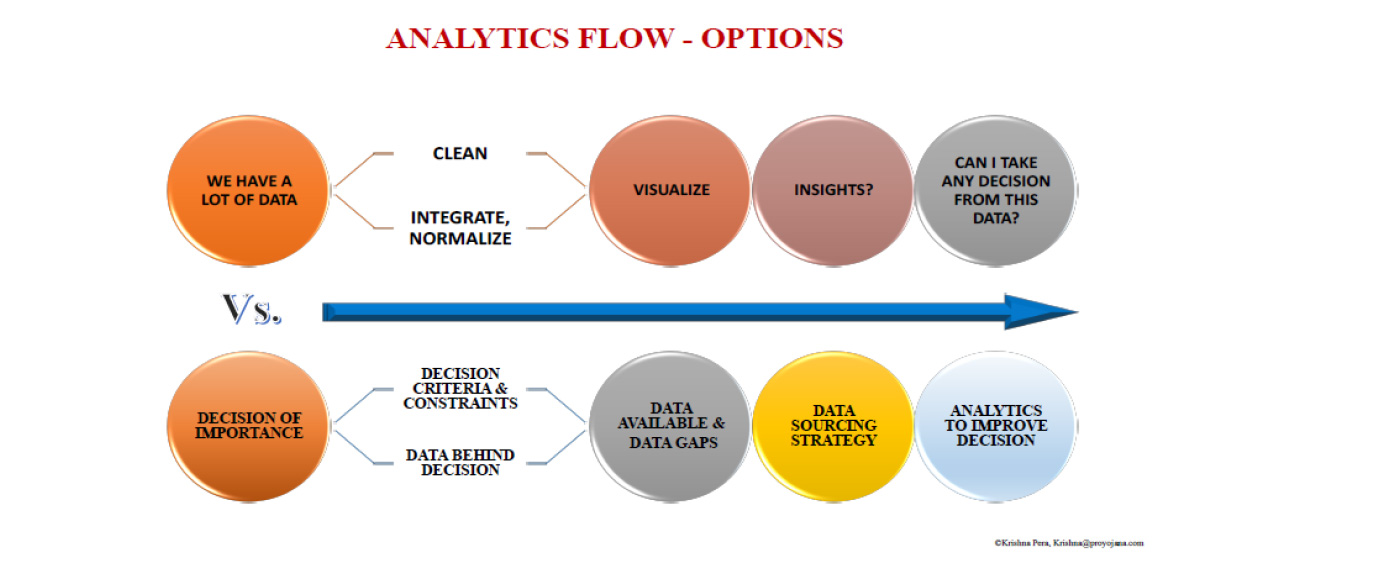
There are two alternate approaches for data design:- Start from the data and scan for ‘actionable insights, if any’. Many companies take this approach.
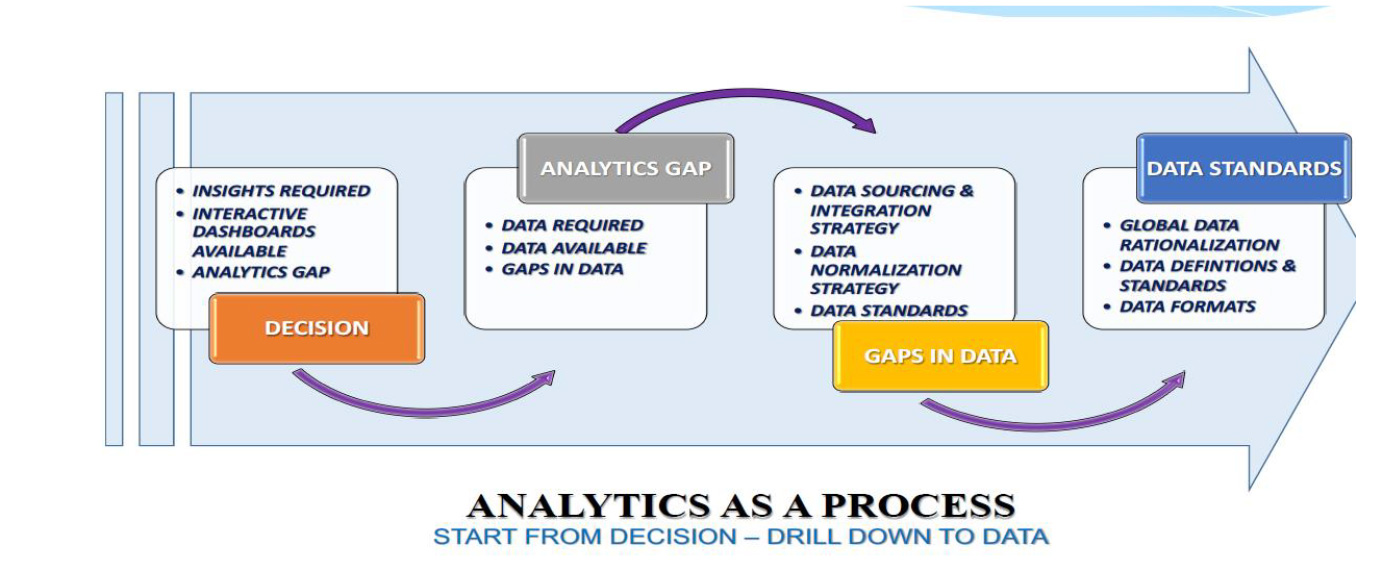
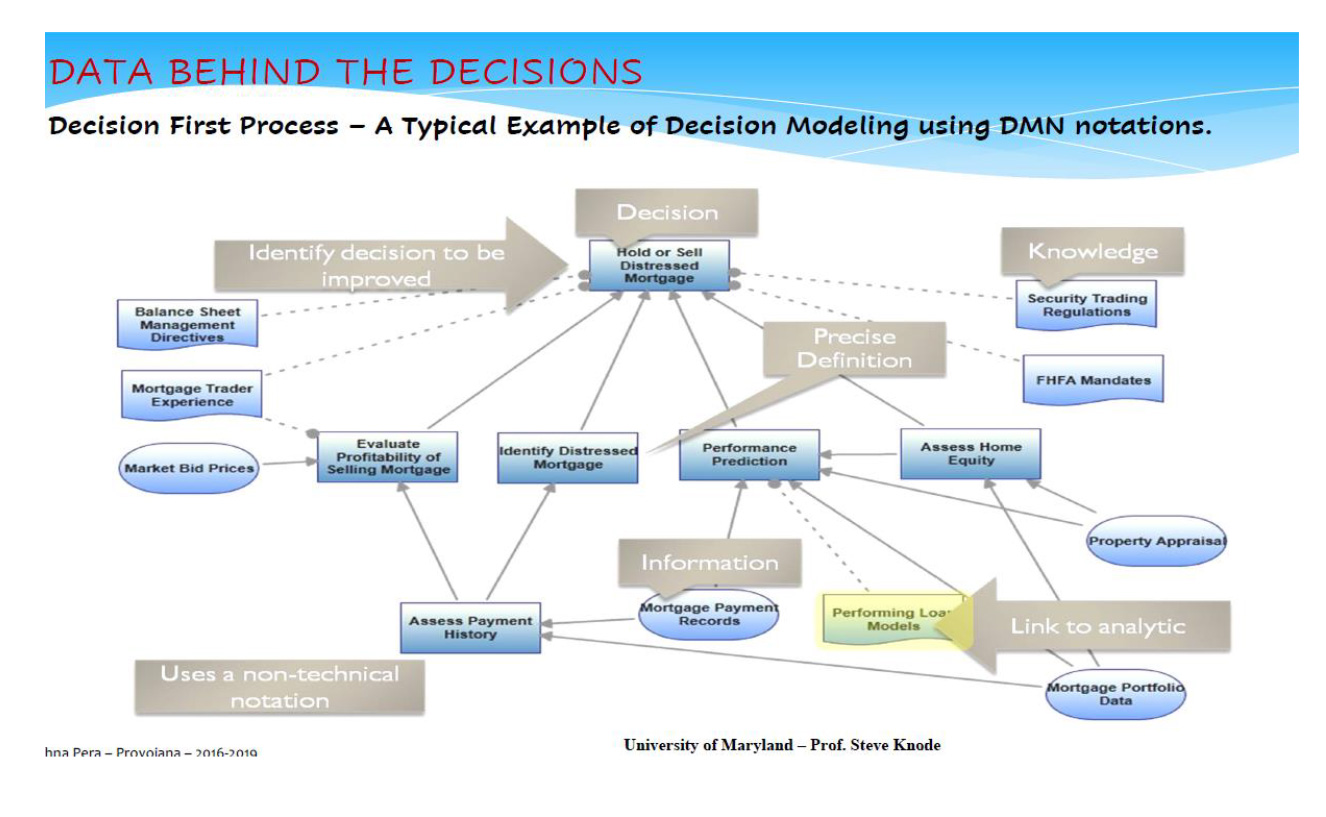
- Start with the decision. Understand the data behind the decisions: Derive the data definitions from the decision-making criteria, the variables, and the constraints.
Indeed, Mr. Pera repeatedly emphasizes one should first identify the “Big” Decisions – the 10% of the decisions that account for 90% of business outcomes. This is not as easy as it sounds. The ‘annualized $ value of each decision’ is difficult to estimate. Big Decisions are not necessarily those taken by CEOs. They can be smaller operational decisions taken by the hundreds of every-day managers hundreds of times in a year, across geographies.
Once Organizations identify the ‘big decisions’, they can re-prioritize among the big-decisions based on a variety of factors such as data availability, seniority of Decision Makers, etc. besides $ value. Creating a ‘Big Decision Roadmap’ – involves focusing the analytics investments on 10% of the decisions that account for 90% of business outcomes.
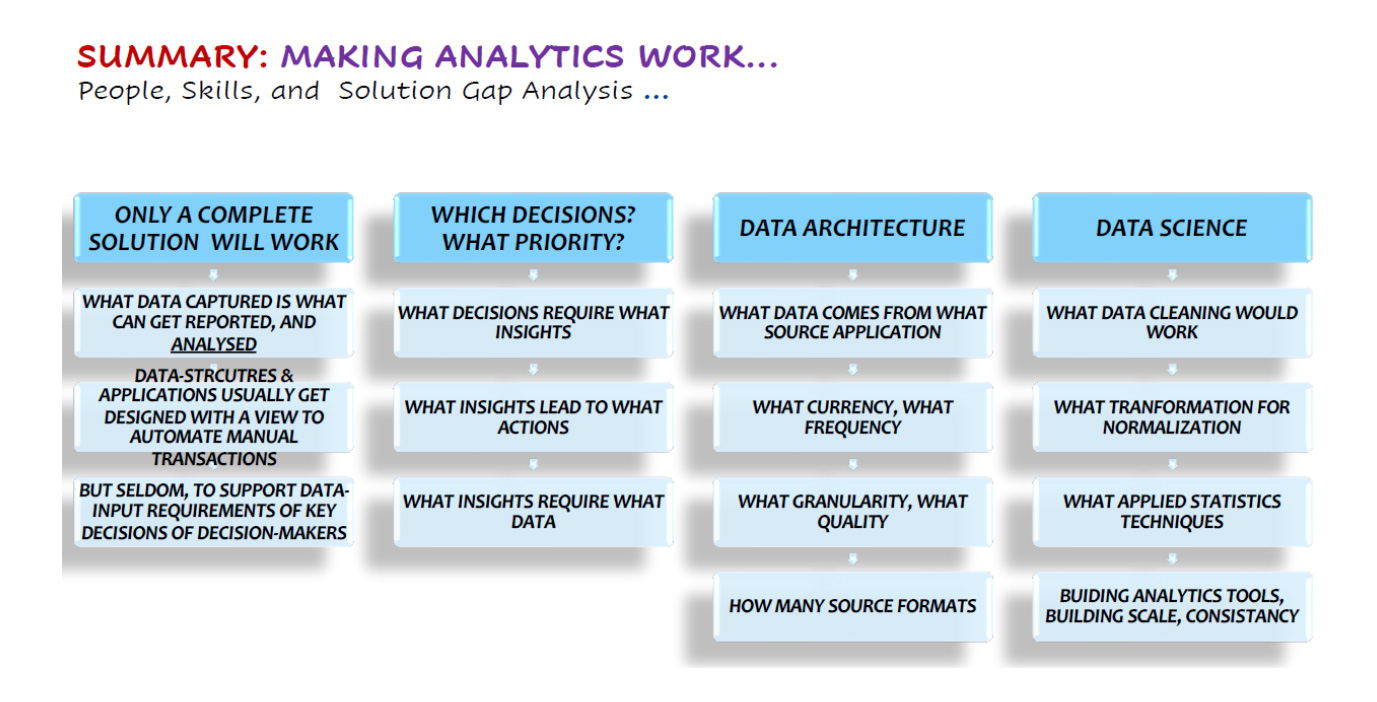
For each decision, companies must work out the data needed. What is the data needed to support and improve the quality of decisions? What data is required for automating the decisions? What data is required for possible AI investments?
However, it is important to understand you may not have all the data that you need within the organization, and the ‘quality of data’ you have may not be adequate. Since you cannot magically produce the data that you may not have, or magically improve the quality of data, it is important to understand the necessity for reengineering the complete data lifecycle: reengineer from the grassroots, from data to decisions…starting from data definitions and data standards.
The Data Conundrum
As Mr Pera put it, the real question is: do you have all the data that you need? Usually, only a part of the data that you need will be available within the company. Out of this, accessible, formatted data will make up an even smaller proportion.
Data everywhere but no insights
Many companies swim in data. But they just do not know what to do with all that data, or what part of it is really useful. They have islands of disconnected IT applications in different locations that do not talk to each other. They often lack common data standards and data definitions and ‘granularity’ for drill-down at the required depth. The data capture process lacks consistency as organizations seldom have global standard processes. In essence, the missing element is the integrated business-information-technology backbone necessary to generate clean, analyzable data required for timely-actionable-insights.
The problem is much more severe in large transnational companies. The three V’s – Volume, Variety, and Velocity are far greater in multinational conglomerates. The fact that they suffer from severe data-quality issues reflects in the unusually long time they take for releasing the audited fiancials at the end of every quarter. Many of them take six weeks plus for the closure of financials at the end of the quarter, while the most well-run firms take less than two weeks. The problem is bigger for large MNCs as they have too much democracy when it comes to data. As a result, subsidiaries make their own decisions. Companies with only domestic operations are somewhat better placed.)
Generative AI
AI helps in “automating the action” based on the “Insights.” Generative AI helps in speeding up the journey from insights to impact. Generative AI greatly improves the quality of insights. It generates better insights even from nonstructured data consolidated from multiple sources. Generative AI can be used to create synthetic data, and even training data necessary for training AI-ML algorithms.
Q&A
As mentioned earlier, the trick is to start with the decisions that we are trying to improve and not with the data. What is the dollar value involved?
When execs are asked to talk about key decisions, they often refer to big capital investments or mergers. But the real opportunities to create value through analytics could potentially lie elsewhere. It is important to examine the operational decisions made by an everyday manager; specifically those repetitive decisions made by multiple managers across the organization, many times in a year.
It is also important to understand one-time, point solutions will not create much value. Build enterprise solutions that can be used by every manager whoever makes that decision across the organization.
The type of solution being implemented depends on the project sponsor. When sponsors are talking of point solutions, we must try to push back and recommend enterprise solutions.
As we build enterprise solutions, we must ask: What analytics is needed? What data is needed for the analytics?
A typical use case that you can relate to? Pricing decisions for hotel aggregators. Priceline/Expedia typically book hotel rooms in bulk and then offer them to customers. The key is to set an optimal price for each hotel room, aiming to maximize revenue. This optimal price should attract the maximum number of customers while ensuring profitability. Striking the right balance involves setting a price that customers find reasonable enough to book the room, yet high enough to generate sufficient revenue. The objective is to get the maximum price from each customer and yet make sure all the rooms are sold.
The term Data culture is used loosely and often hyped up. What is important is a fundamental recognition across the organization that data is important... not just that it is important to make decisions based on data, but also that it important to ensure the entire data lifecycle is engineered right…recognition that data governance is the key to ensuring adequate data quality.
Example: Consider the chart of accounts (COA). This is a structured list of financial accounts used by an organization to categorize and record its financial transactions. It serves as the foundation for an organization's accounting system and helps in organizing financial data for reporting and analysis.
As you would know a typical transnational would have a subsidiary company in each country, while different LOBs (Lines of Business) operate across the countries. (Take for example: Unilever India & Unilever Singapore are subsidiaries of Unilever PLC, UK… while Food Products and Cosmetics are separate LOBs that operate across different countries… or each brand could be an LOB).
In the name of laisse-faire data governance, many transnationals made the mistake of letting each country define its own chart-of-accounts, either because it is required for local regulatory compliance, or sometimes just to satisfy the whims of the local CxOs. As each country fully flouted its freedom to define its own COA, soon, there is absolute chaos and zero similarity between COAs of different countries.
Unfortunately, a Transnational still needs to consolidate accounts at the Global Headquarters both for statutory reporting and for global management control. They also may need to look at consolidated global P&L for each LOB, and each brand.
The result?
Accounts reconciliations and the global consolidation of the accounts each quarter-end become an absolute nightmare, involving long hours of work, a battery of CAs and brute force. Releasing audited financial results take anywhere between 6-8 weeks after the quarter-end. Given the data quality is suspect, and in the absence of drill-down visibility external auditors have no choice but to close their eyes, or include enough caveats and audit-notes in audit statements.
Assuming it is implemented well, and not defunct, a MDM implementation helps in ensuring consistency in master data across different application instances within the organization.
So, it is important to fix MDM first. MDM helps you ensure consistency in data definitions and data standards; it helps you define all master data in one place, before replicating it to different applications. Each customer, or each material should have only one code, across different applications. E.g.: India Hotels is a big customer of Maruti. Then different units of India Hotels if they are buying cars from Maruti should not have different customer codes.
We should also ask what kind of data is being captured and what is not. Also, how is it captured?
Too many Excel sheets floating around in an organization is a cause for alarm. Reconciliation of data between different Excel sheets, data validation, ensuring authentication and data consistency, etc. is a very difficult exercise. Too many Excel sheets floating around indicate there are serious information supply chain bottlenecks. Excel data ideally must be moved to a web application as quickly as possible. Data lying in spreadsheets is an auditor’s nightmare. With an ERP, queries/drill-downs and validation can be done instantaneously.
If for some reason, Excel sheets cannot be avoided, they should be standardised. The formats must be locked and data validation rules should be built for each of the columns. Each Excel sheet should have a unique owner with authorization to change the format if need be. But ideally, one should move away from Excel sheets to MDM and web applications.
Note: MDM is used to define and manage the critical data of an organization. The data may include customers, products, employees, suppliers, and other types of business-critical information.
MDM aims to create a single, authoritative, and consistent source of master data that can be shared across an organization. This ensures that across the organization, people are using the same accurate and up-to-date data.
MDM establishes data governance policies, data standards, and data quality rules. This helps prevent data inconsistencies, errors, and redundancies.
MDM often involves integrating data from various source systems and applications across the organization. This integration helps eliminate data silos and provides a unified view of data.
MDM involves establishing processes, roles, and responsibilities for managing and maintaining master data. Data stewards are typically assigned to ensure data quality and compliance with policies.
MDM ensures that data is typically organized into hierarchies or taxonomies. For example, in customer master data, we might have parent companies, subsidiaries, and individual customers, all organized hierarchically.
MDM encompasses the entire data lifecycle, from data creation and entry to archival and deletion. It ensures that data is accurate and relevant throughout its lifecycle.
Implementing MDM can lead to several benefits, including improved data quality, enhanced decision-making, reduced operational costs, increased agility, and better customer and partner relationships.
MDM is particularly important in large organizations with diverse data sources and a need for accurate and consistent data across various departments and systems. It helps organizations make more informed decisions, reduce errors, improve operational efficiency, and respond more effectively to changing business needs.
One should first make a broad choice: to be a techie or a consultant.
MBAs are better off being consultants. They can focus less on coding and more on the holistic understanding of the problem being solved and the business value generation.
Techies can be more specialized. They should be very good in one or two technologies. Then they can easily pick up other technologies. In the case of Gen AI / LLMs for example, they can try learning Falcon or Llama, besides Open AI.
When we are trying to skill ourselves, we must choose areas that cannot be easily taken over by robots.
Use of IT and data analytics in the pharma industry is not new. The industry has documentation running into 100,000 pages or more for the development of new drugs. Trials should be monitored carefully and all the data allected analysed for insights. One important use case is Adverse Events Reporting. AER requires careful analysis. Huge amounts of data are involved. Earlier the number crunching would take time. Today, thanks to tools like Hadoop, the time to process data has been reduced.
Note: Adverse Event Reports (AERs), also known as Adverse Drug Reaction (ADR) reports contain information about unexpected or undesirable effects or incidents related to the use of a drug, medical device, vaccine, or any other healthcare intervention. These reports play a crucial role in monitoring and ensuring the safety of medical products and interventions across geographies.
The primary purpose of AERs is to collect, document, and report any adverse events or adverse reactions that occur in patients or users of a particular medical product. These reports help regulatory agencies, healthcare providers, and manufacturers monitor the safety profile of the product.
An AER typically includes details about the adverse event or reaction, such as the patient's or user's information, the date of the event, the healthcare product involved, the severity of the event, any relevant medical history, and a description of the adverse event itself.
AERs can come from various sources, including healthcare professionals (doctors, nurses, pharmacists), patients, consumers, and manufacturers. Healthcare providers are often required to report adverse events that they become aware of during patient care.
Regulatory agencies, such as the U.S. Food and Drug Administration (FDA) in the United States or the European Medicines Agency (EMA) in Europe, maintain databases of AERs. They use these reports to monitor the safety of medical products and, if necessary, take regulatory actions, such as issuing warnings, recalls, or label changes.
The science and activities related to the detection, assessment, understanding, and prevention of adverse effects or any other drug-related problems are collectively known as pharmacovigilance. AERs are a fundamental component of pharmacovigilance efforts.
Depending on the country’s regulatory framework, there may be legal requirements to report adverse events associated with medical products. Failing to report serious adverse events can have legal consequences.
Recommends No Code applications for someone with limited or no experience with coding.
Says his experience with these tools is dated. These tools depend on componentisation of code and componentising code is not easy. But they might have improved over time.
Imagine a set of managers are to collectively make a decision: their intuitions may prompt them to take diagonal and opposing views. Complete consistency is unlikely, and decisions are usually negotiated between competing perspectives. In contrast, decisions based on data are more likely to exhibit consistency, regardless of who is making those decisions.
So, depending solely on intuition is not a wise approach. However, if you could resolve 80% of the ambiguity with the help of data that is available, the rest can be based on ones’ intuition. Then, it is legitimate.
Ultimately, any decision one takes should be able to withstand the scrutiny of an audit. If decisions are taken solely based on instinct, they will not pass the test.
When we are entering a new market for existing products, or launching a new product, there may be no internal data available. And one needs data for creating a blue-ocean strategy.
In such cases, it will be ideal to source the ‘data required’ through a survey of the target market segment; and use a random sampling technique to simulate the population data.
While you may or may not get it right the first time, both the quality of the data and the model will improve over time.